Blog
Access alternative data from a range of non-traditional sources to uncover new insights, identify emerging trends and gain a deeper understanding of companies and markets.

Alternative data refers to information collected from non-traditional sources that can provide additional insights into companies, markets, consumers and the wider economy.
Unlike traditional financial data, such as company filings, earnings reports and economic statistics, alternative data can capture real-world activity and behaviour as it happens. Sources can include consumer transactions, web and app activity, geolocation data, satellite imagery, sentiment and other commercial signals.
For investors, analysts and businesses, alternative data can complement traditional research, helping identify emerging trends, monitor changes in activity and uncover signals that may not be visible through conventional data sources.
Alternative data spans a broad range of non-traditional sources, providing unique insights into companies, markets, consumers, etc.
The right dataset can help answer specific research questions, identify emerging trends and complement traditional financial information.
Receipt data showing what consumers buy and how much they spend.
Card and point-of-sale transactions showing spending at specific companies and merchants.
Data gathered from websites, such as pricing, product listings, technology usage and property listings.
Data from industry participants, such as advertising agencies, app usage panels and semiconductor pricing.
Points of interest, flight and cruise activity, and geospatial data showing real-world movement.
Alternative data helps investors, analysts and businesses uncover signals that complement traditional financial and market data.
• Investment Research - Identify trends and signals to support investment decisions.
• Company Analysis - Track activity and indicators that can provide insight into business performance.
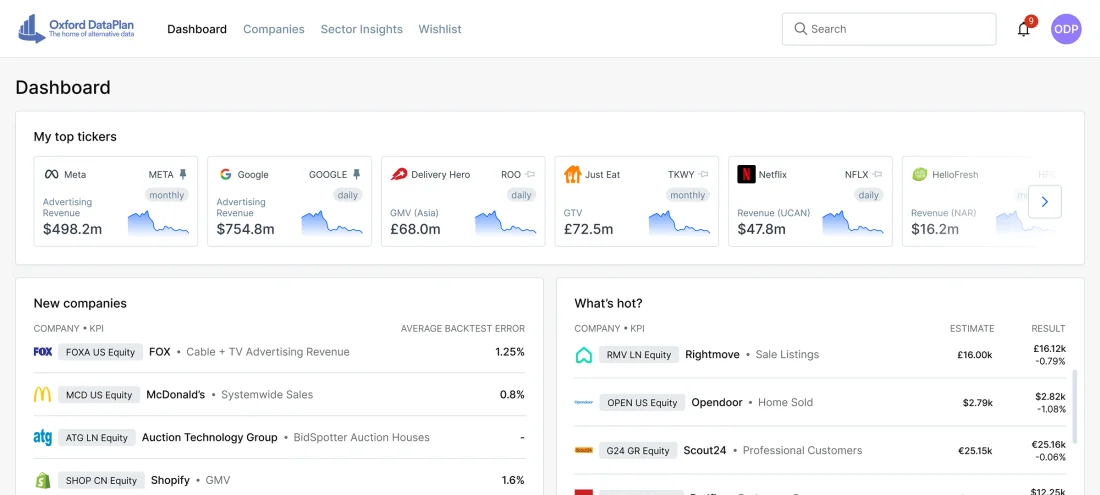
• Revenue and KPI Estimates - Track company performance during the quarter, ahead of reported results.
• Forecasting - Use data-driven signals to build more informed forecasts.
• Risk Monitoring - Identify emerging risks, opportunities and changes in market activity.
• Competitive Analysis - Compare companies and markets using differentiated external data.

Oxford Data Plan turns alternative data into daily KPI estimates for 260+ listed companies, tracking 800+ KPIs across 30+ sectors.
Clients managing $250bn+ in assets use these estimates to follow company performance ahead of reported results.
Discover how our alternative data can support your research and decision-making.